
About

Plan
We wish to provide active insights and knowledge towards coining of plans to better improve and implement Pakistan's National Water Policy.

Research
We invite all who are interested in environmental analytics to provide research and data-driven solutions for water resource management.

Development
We aim to bring researchers and experts together to develop pathways to better management of WEF nexus of Indus Basin.
Indus in Figures
River Inflows
Number of Tubewells
Energy mix percentage for 2019
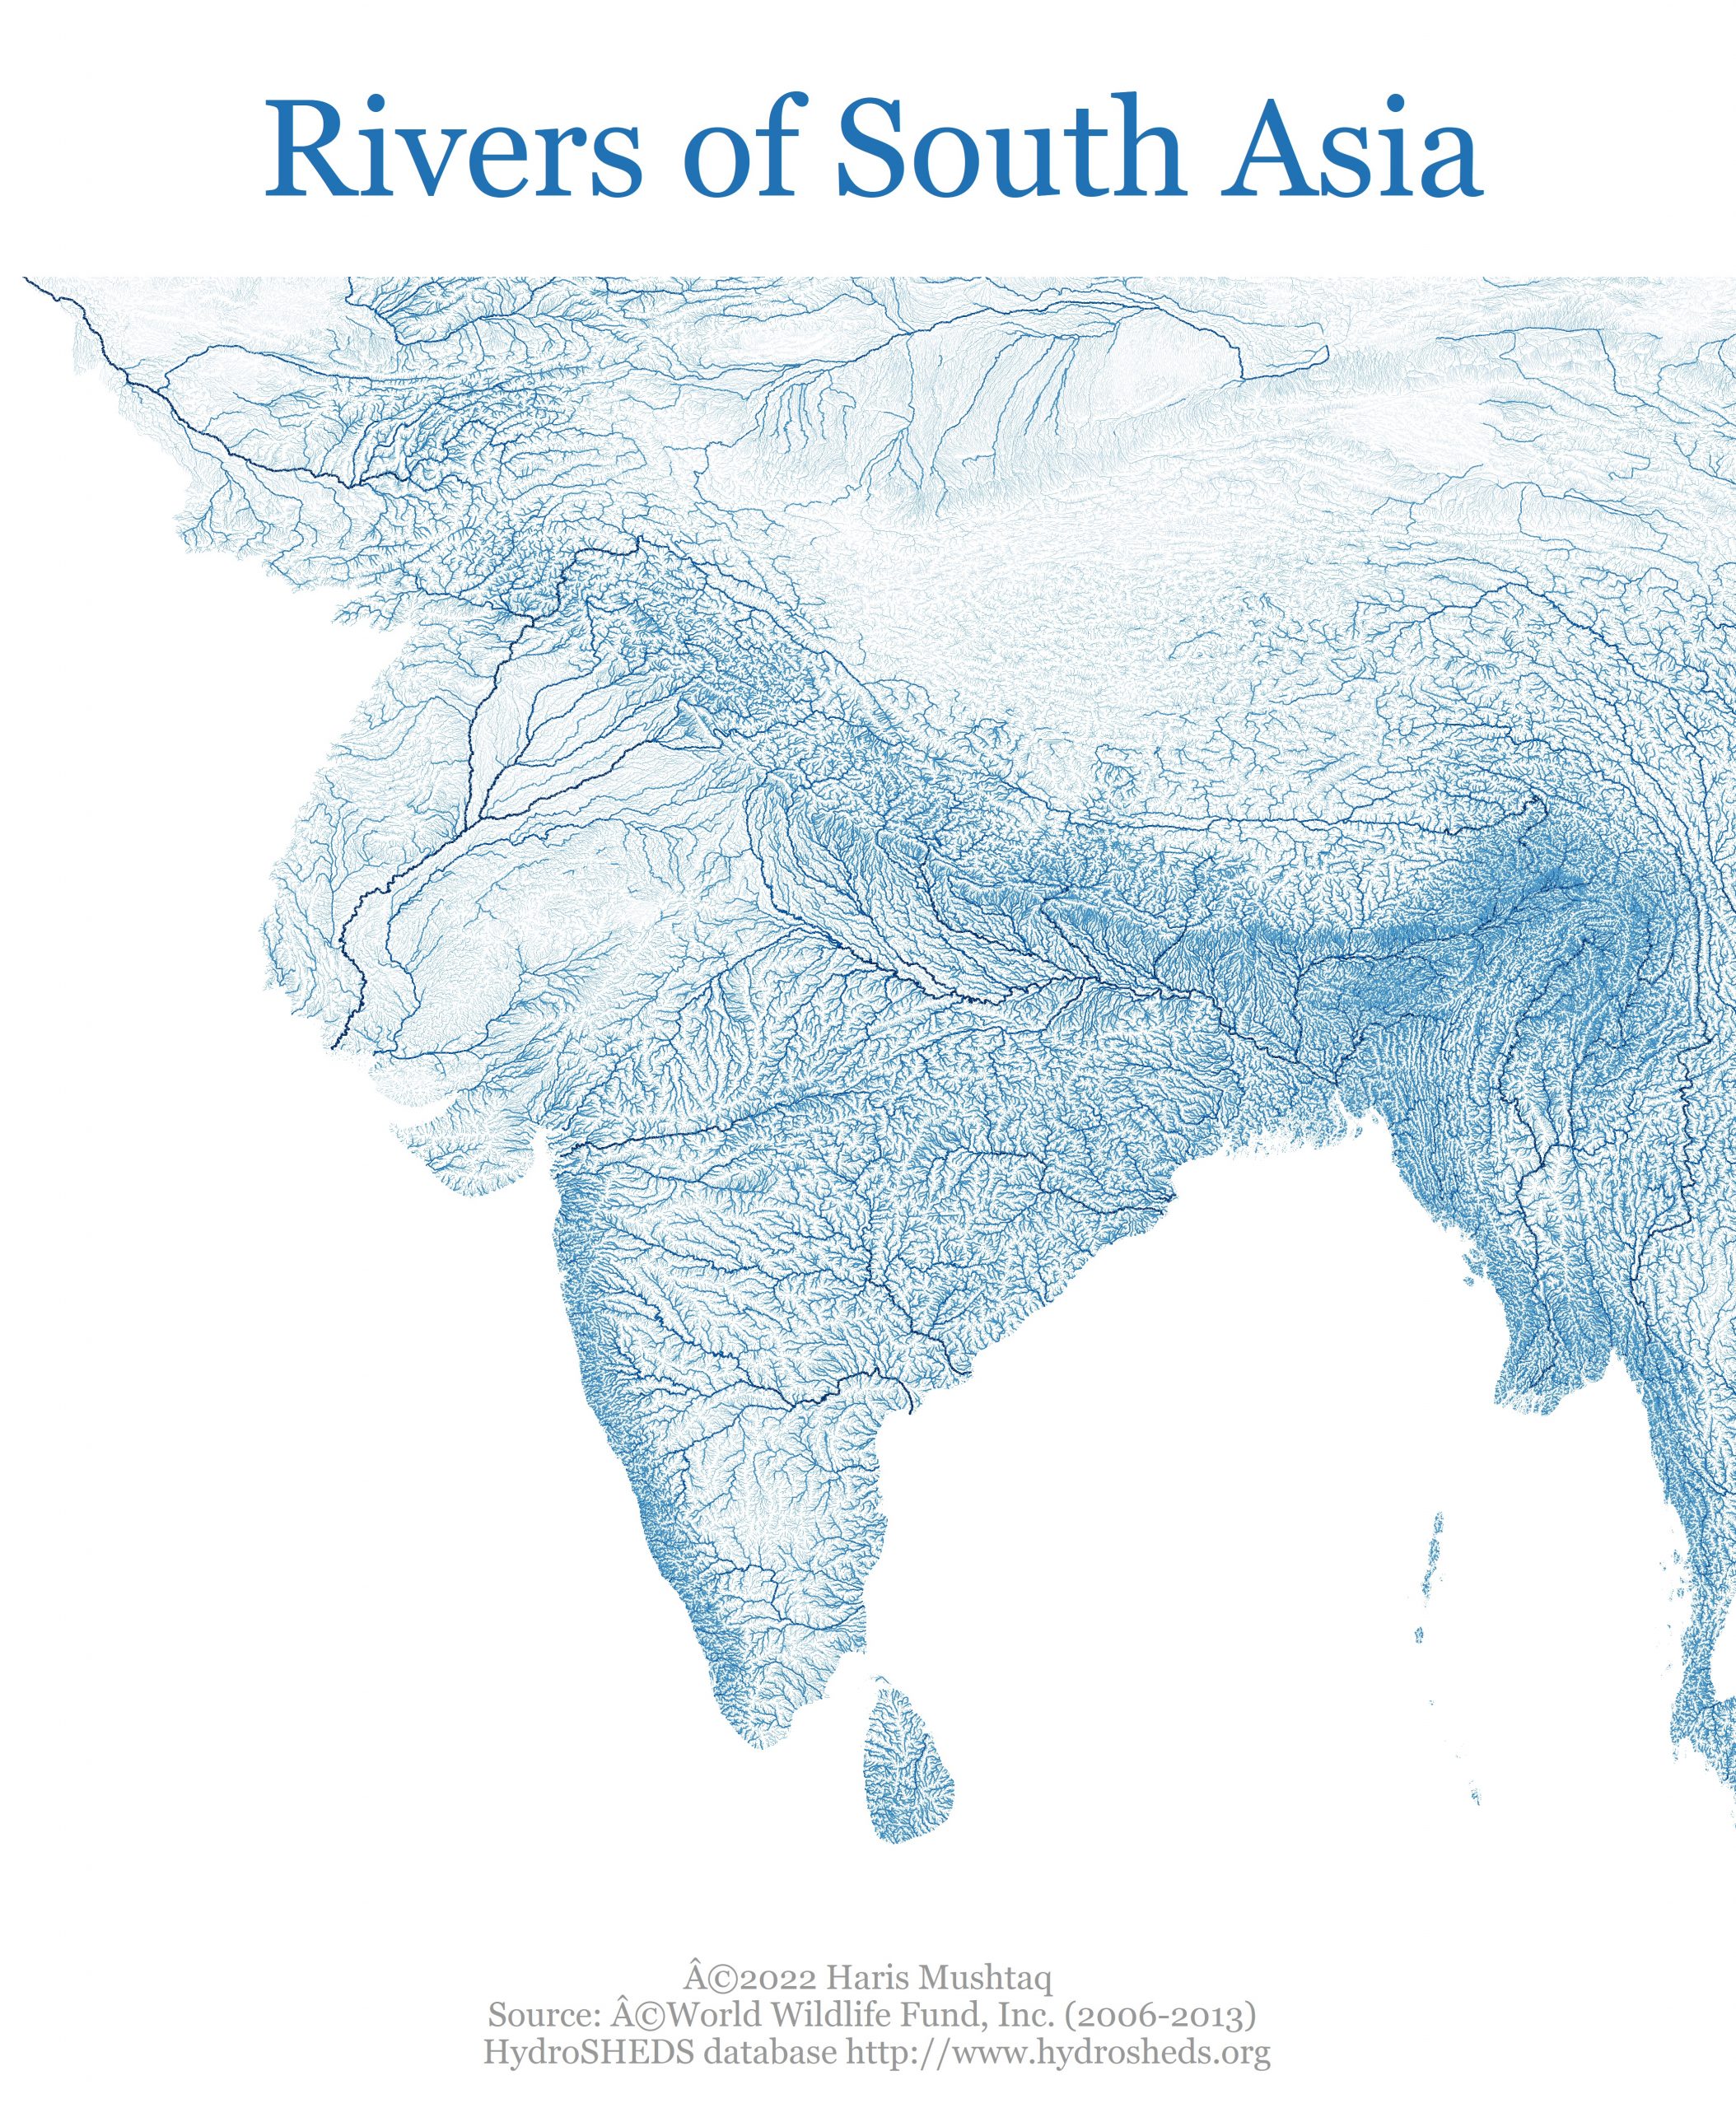
SA rivers updated
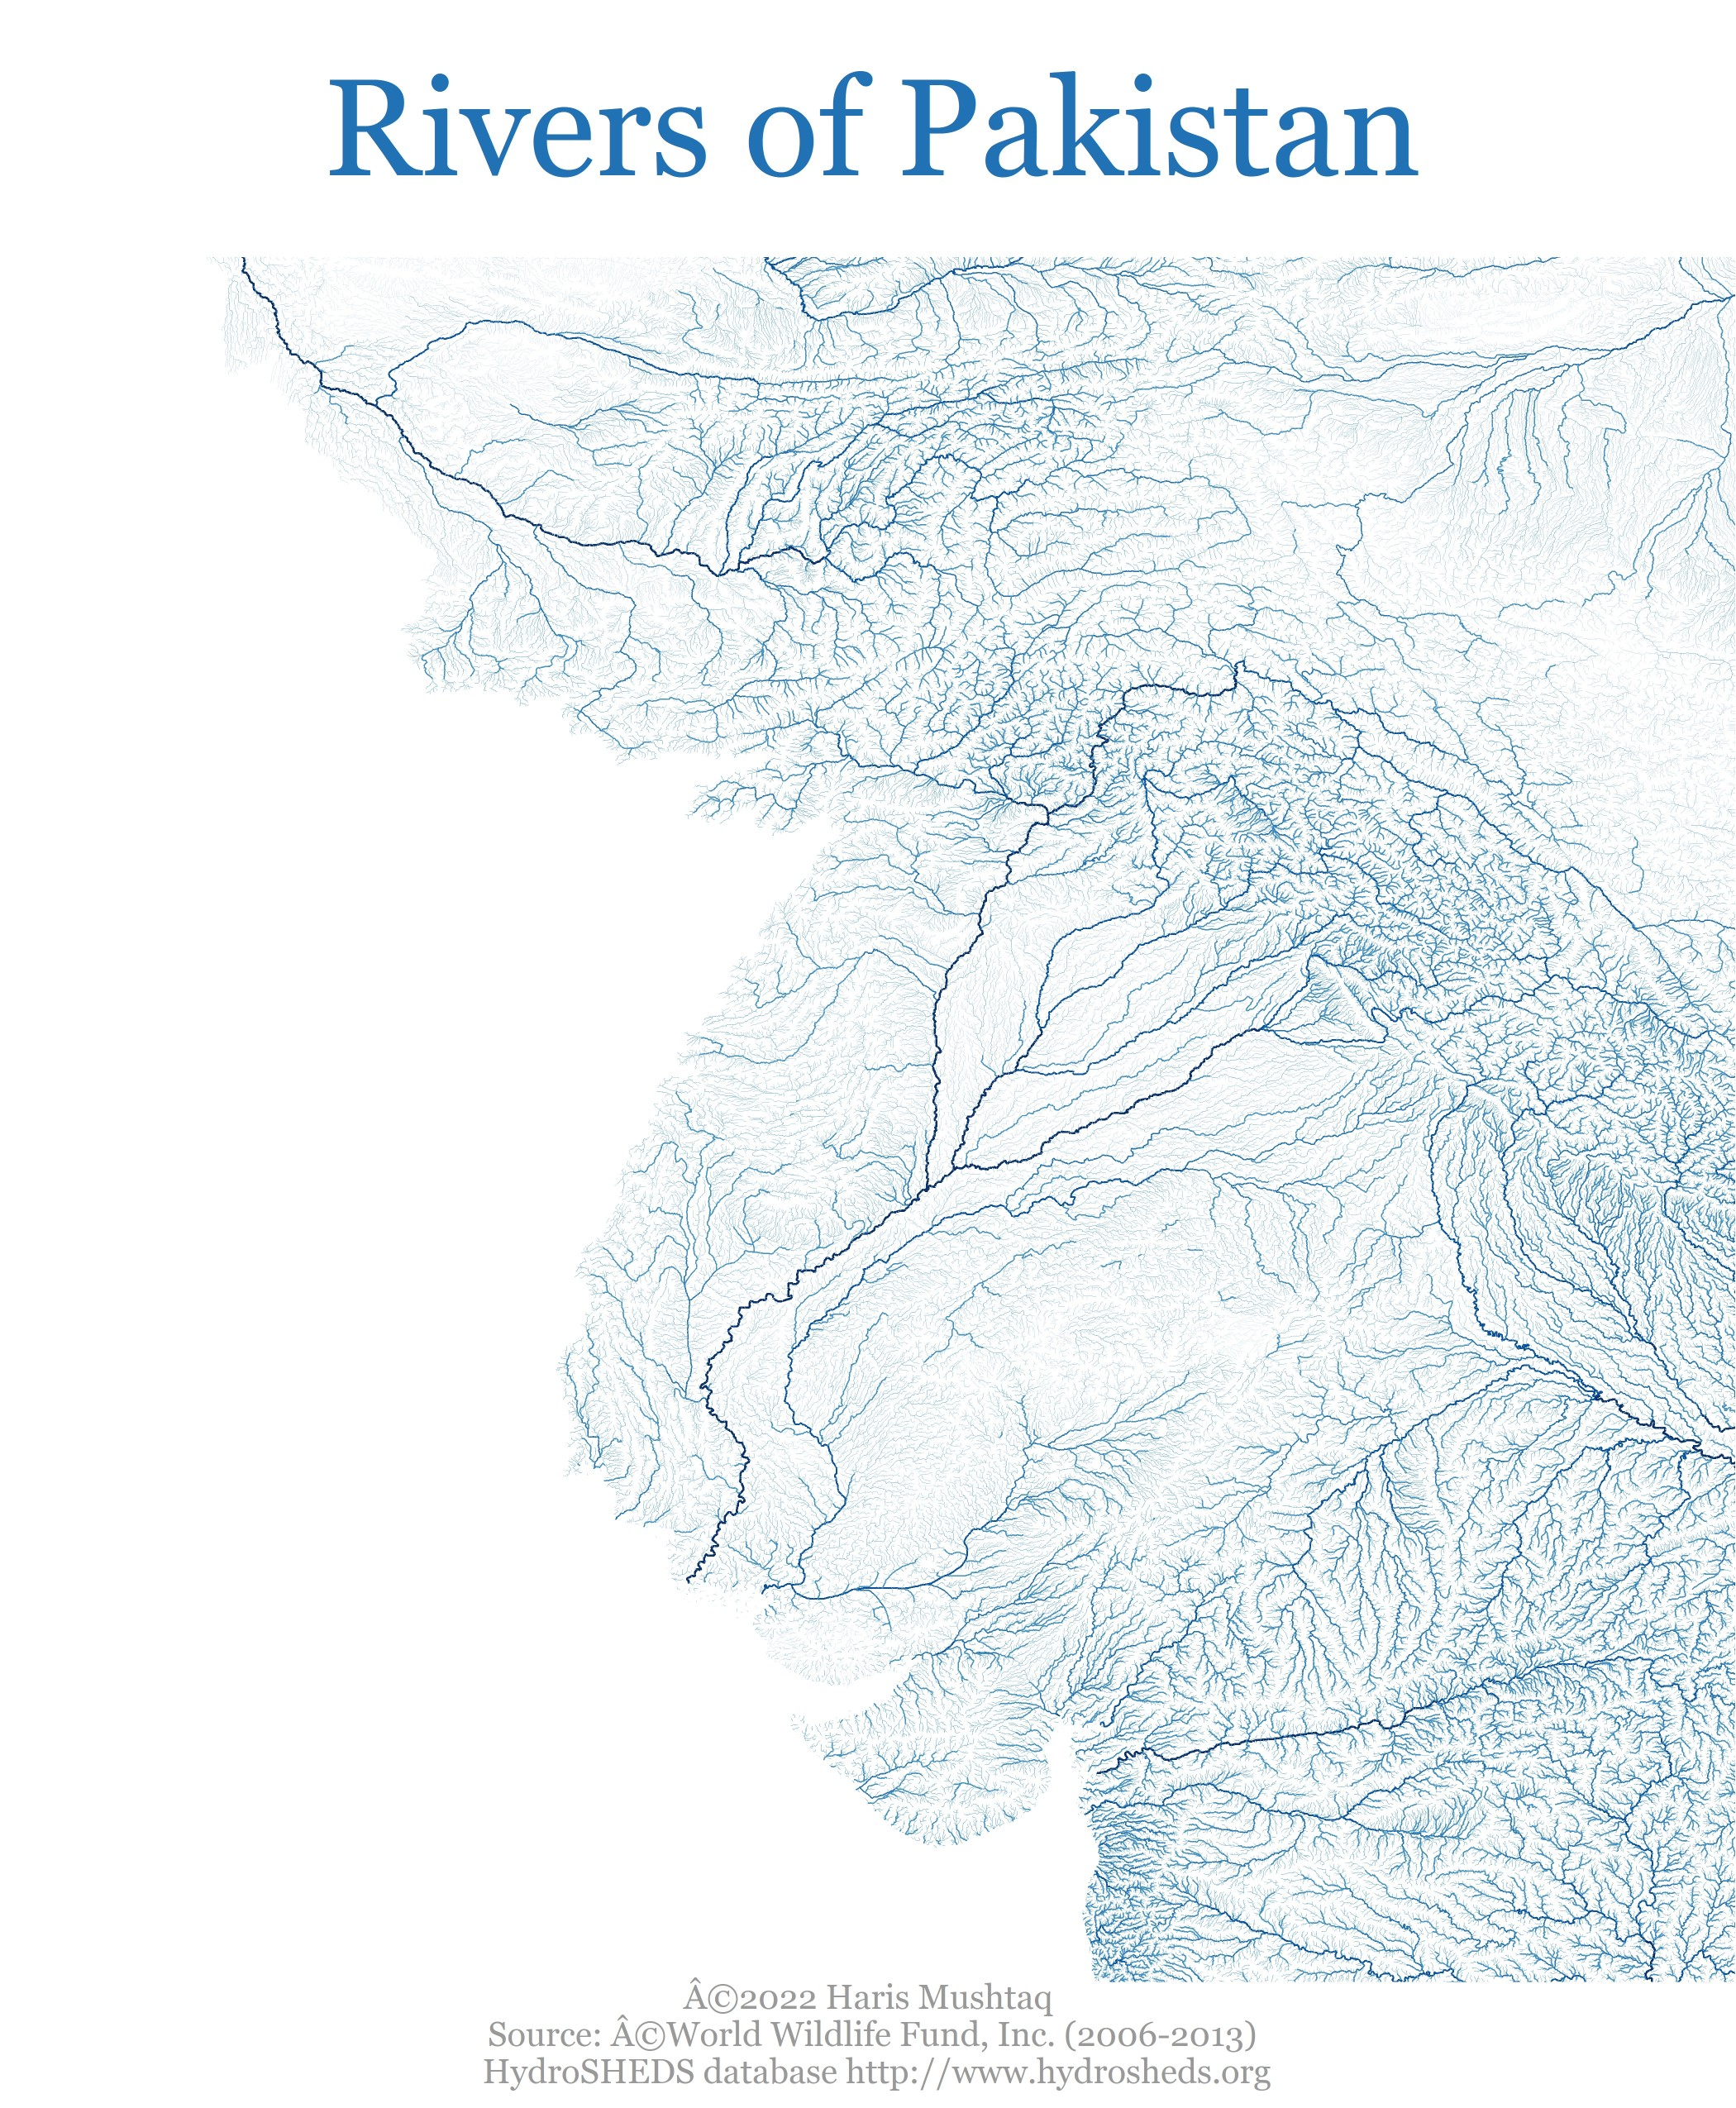
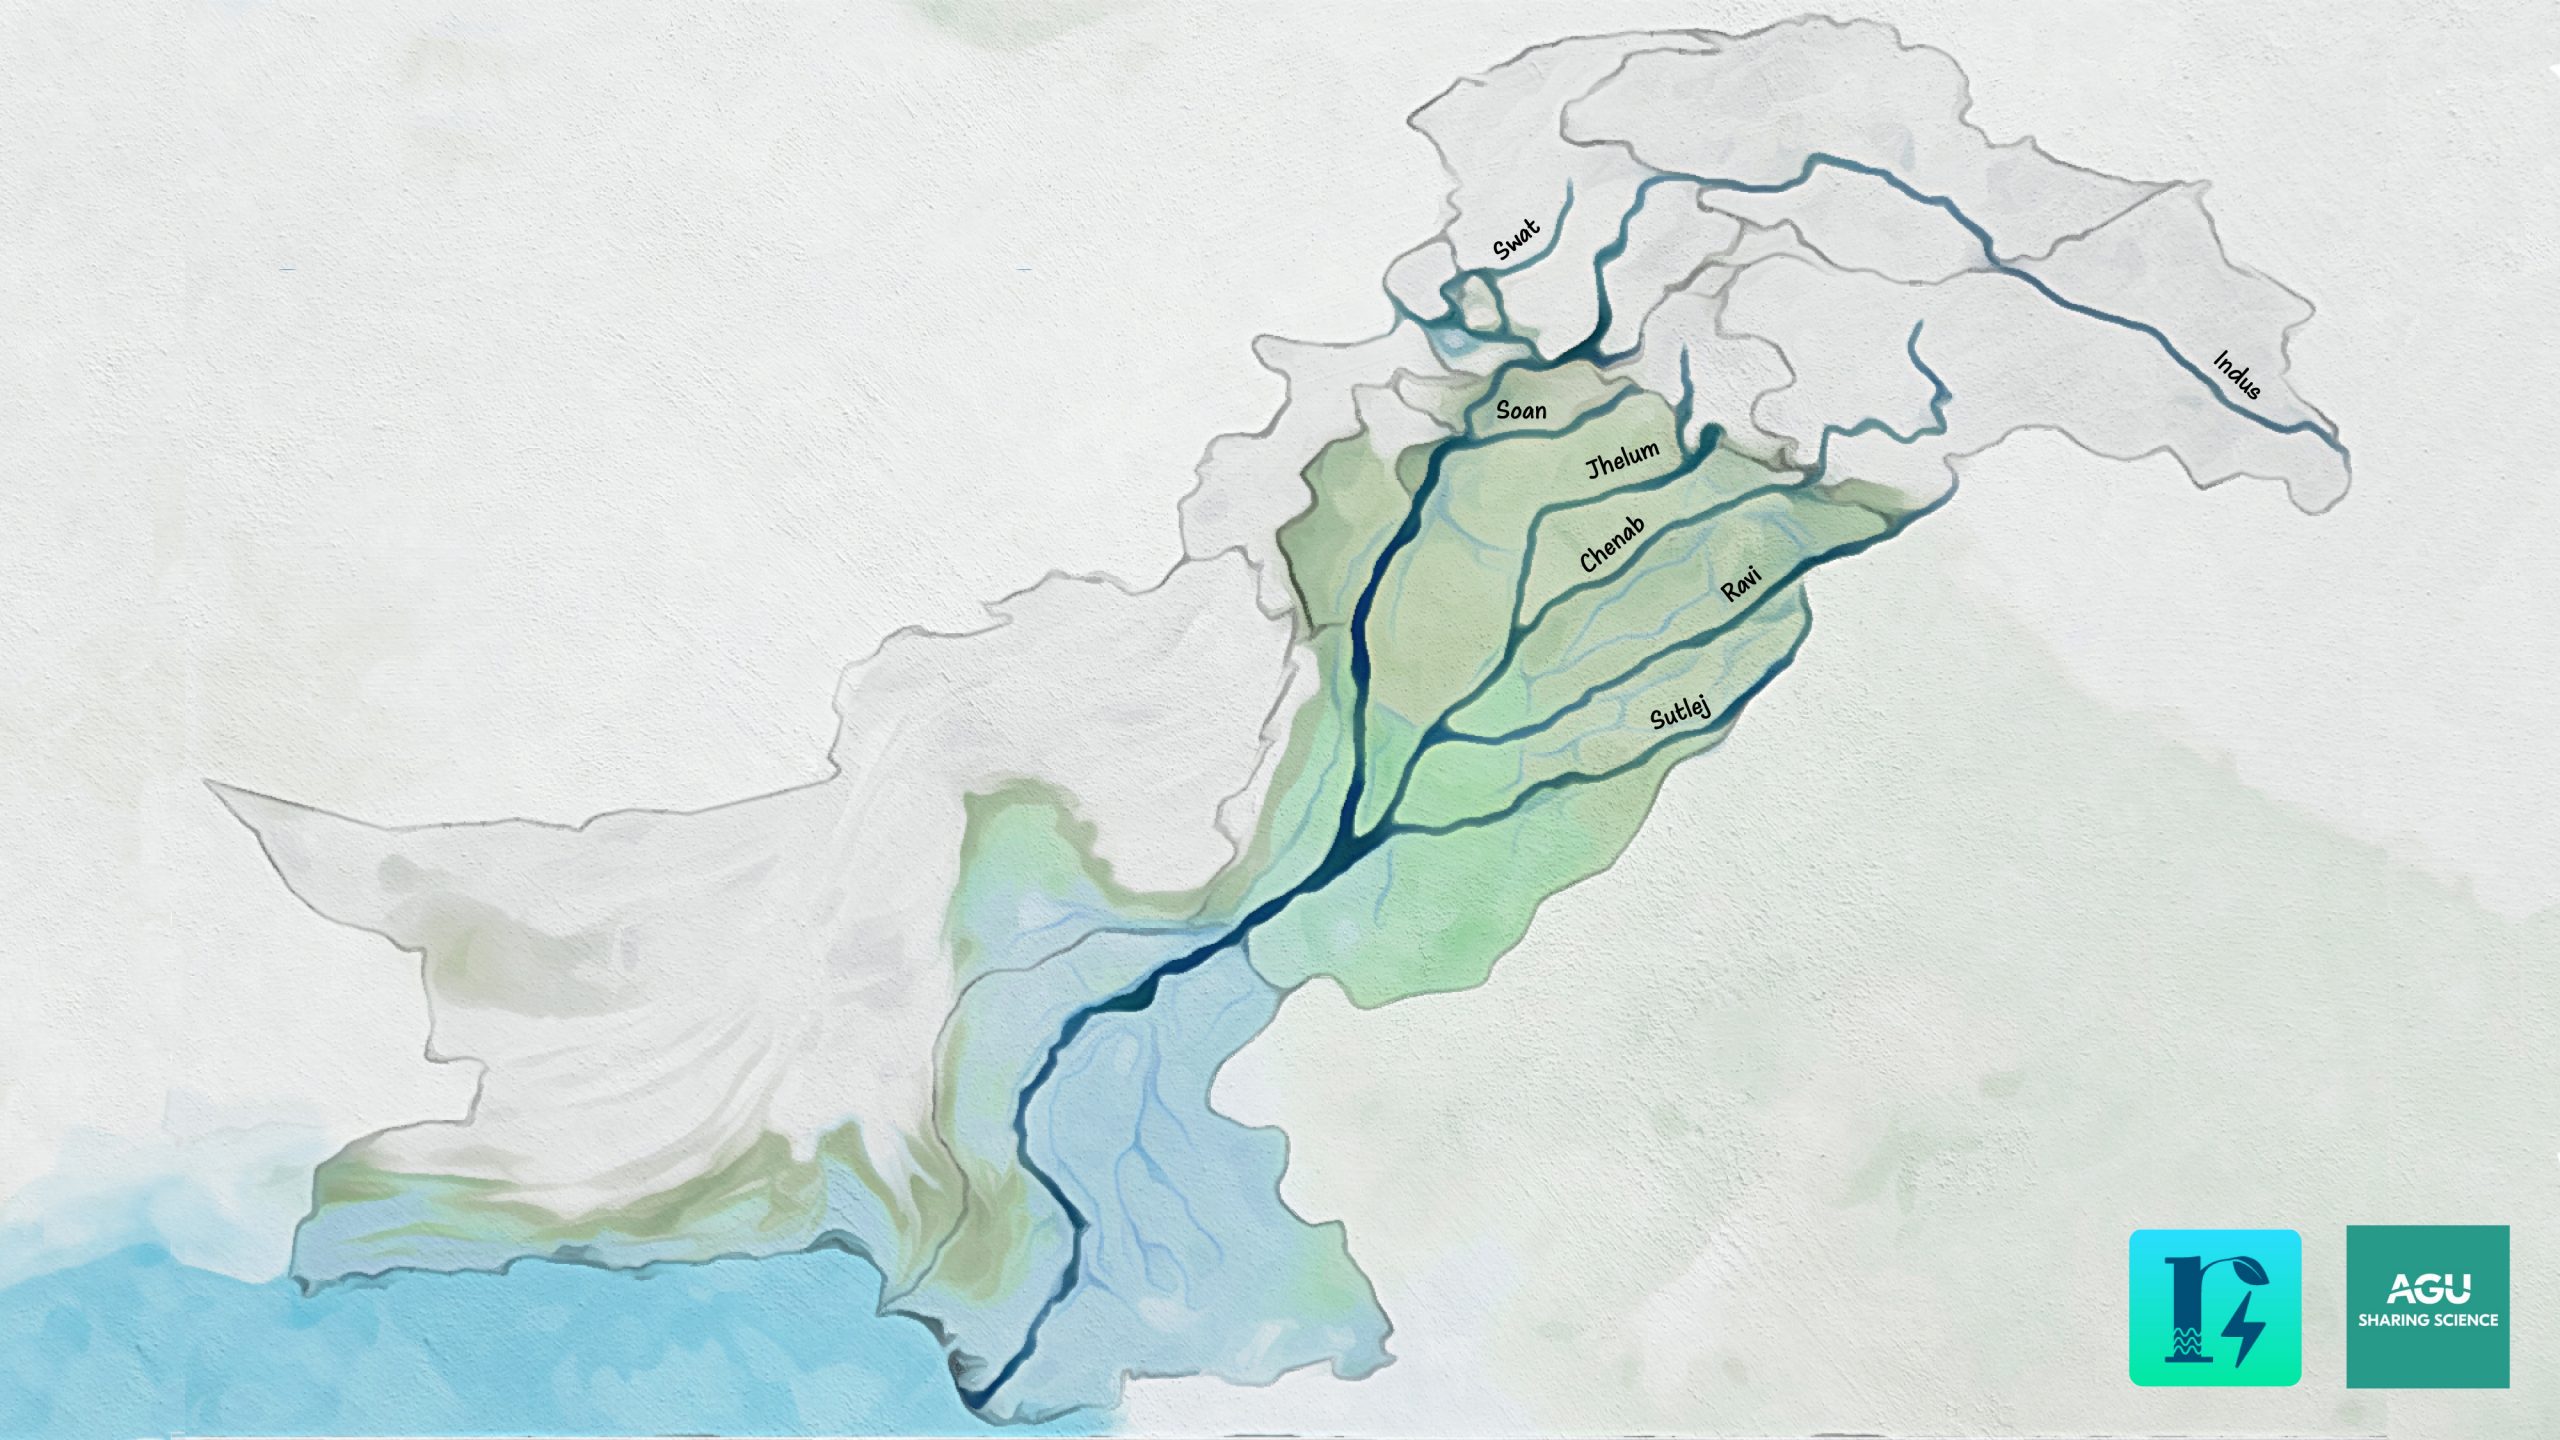
Pak rivers updated
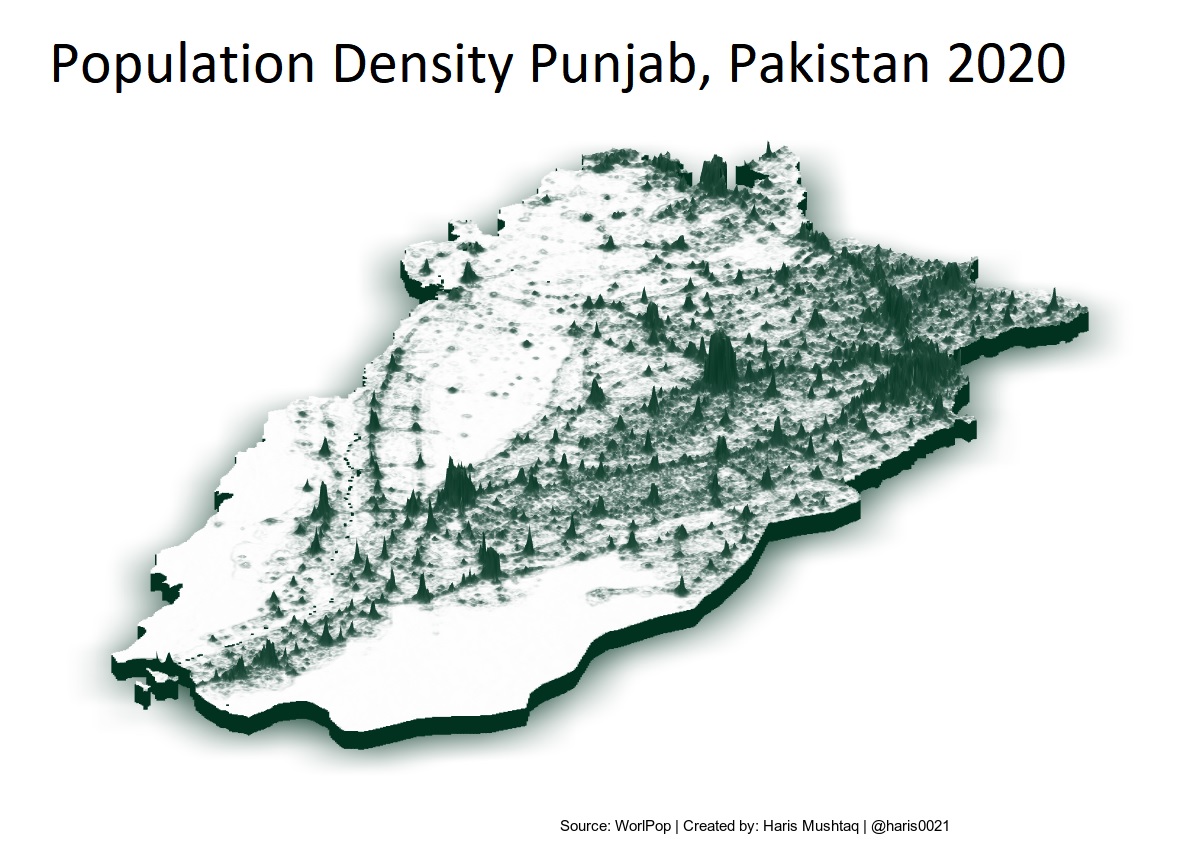
Punjab
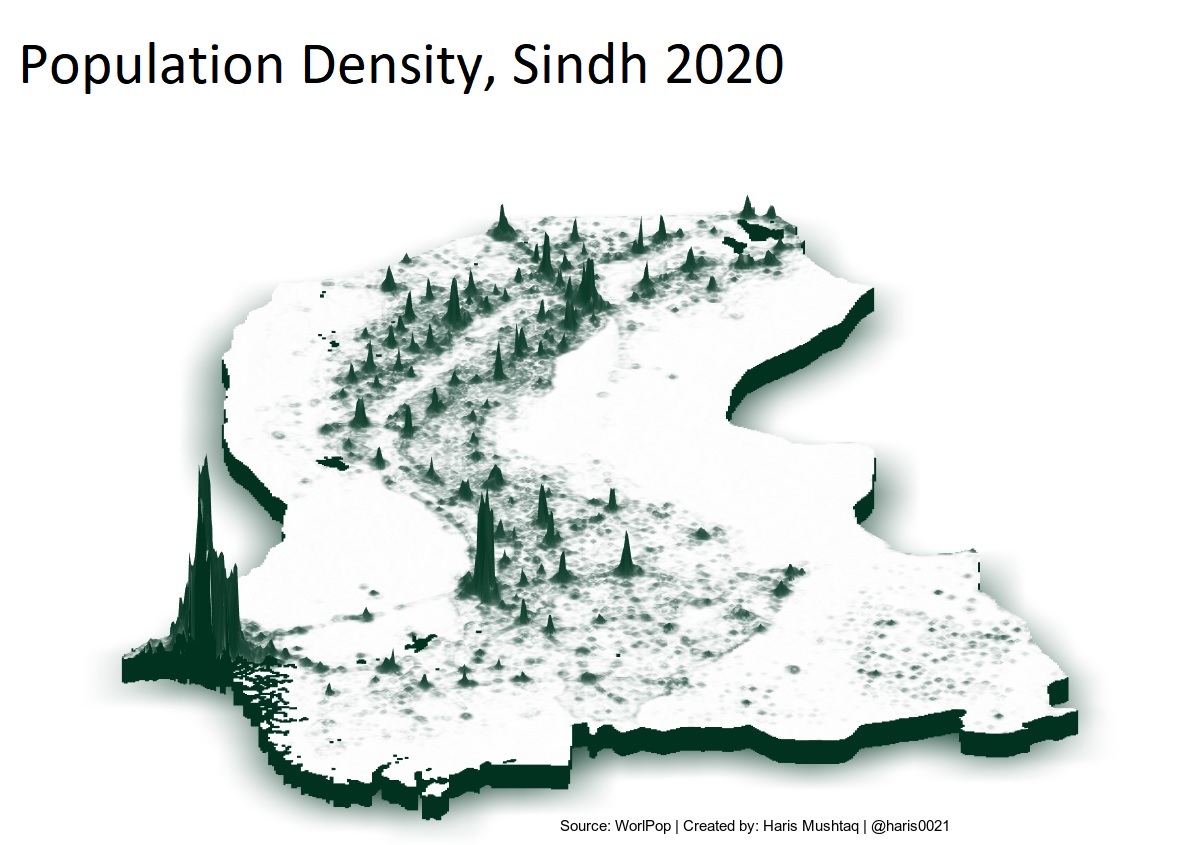
Sindh
Installed capacity by Type (Mw)
Water Availability pc
Avg. Annual Electricity consumption
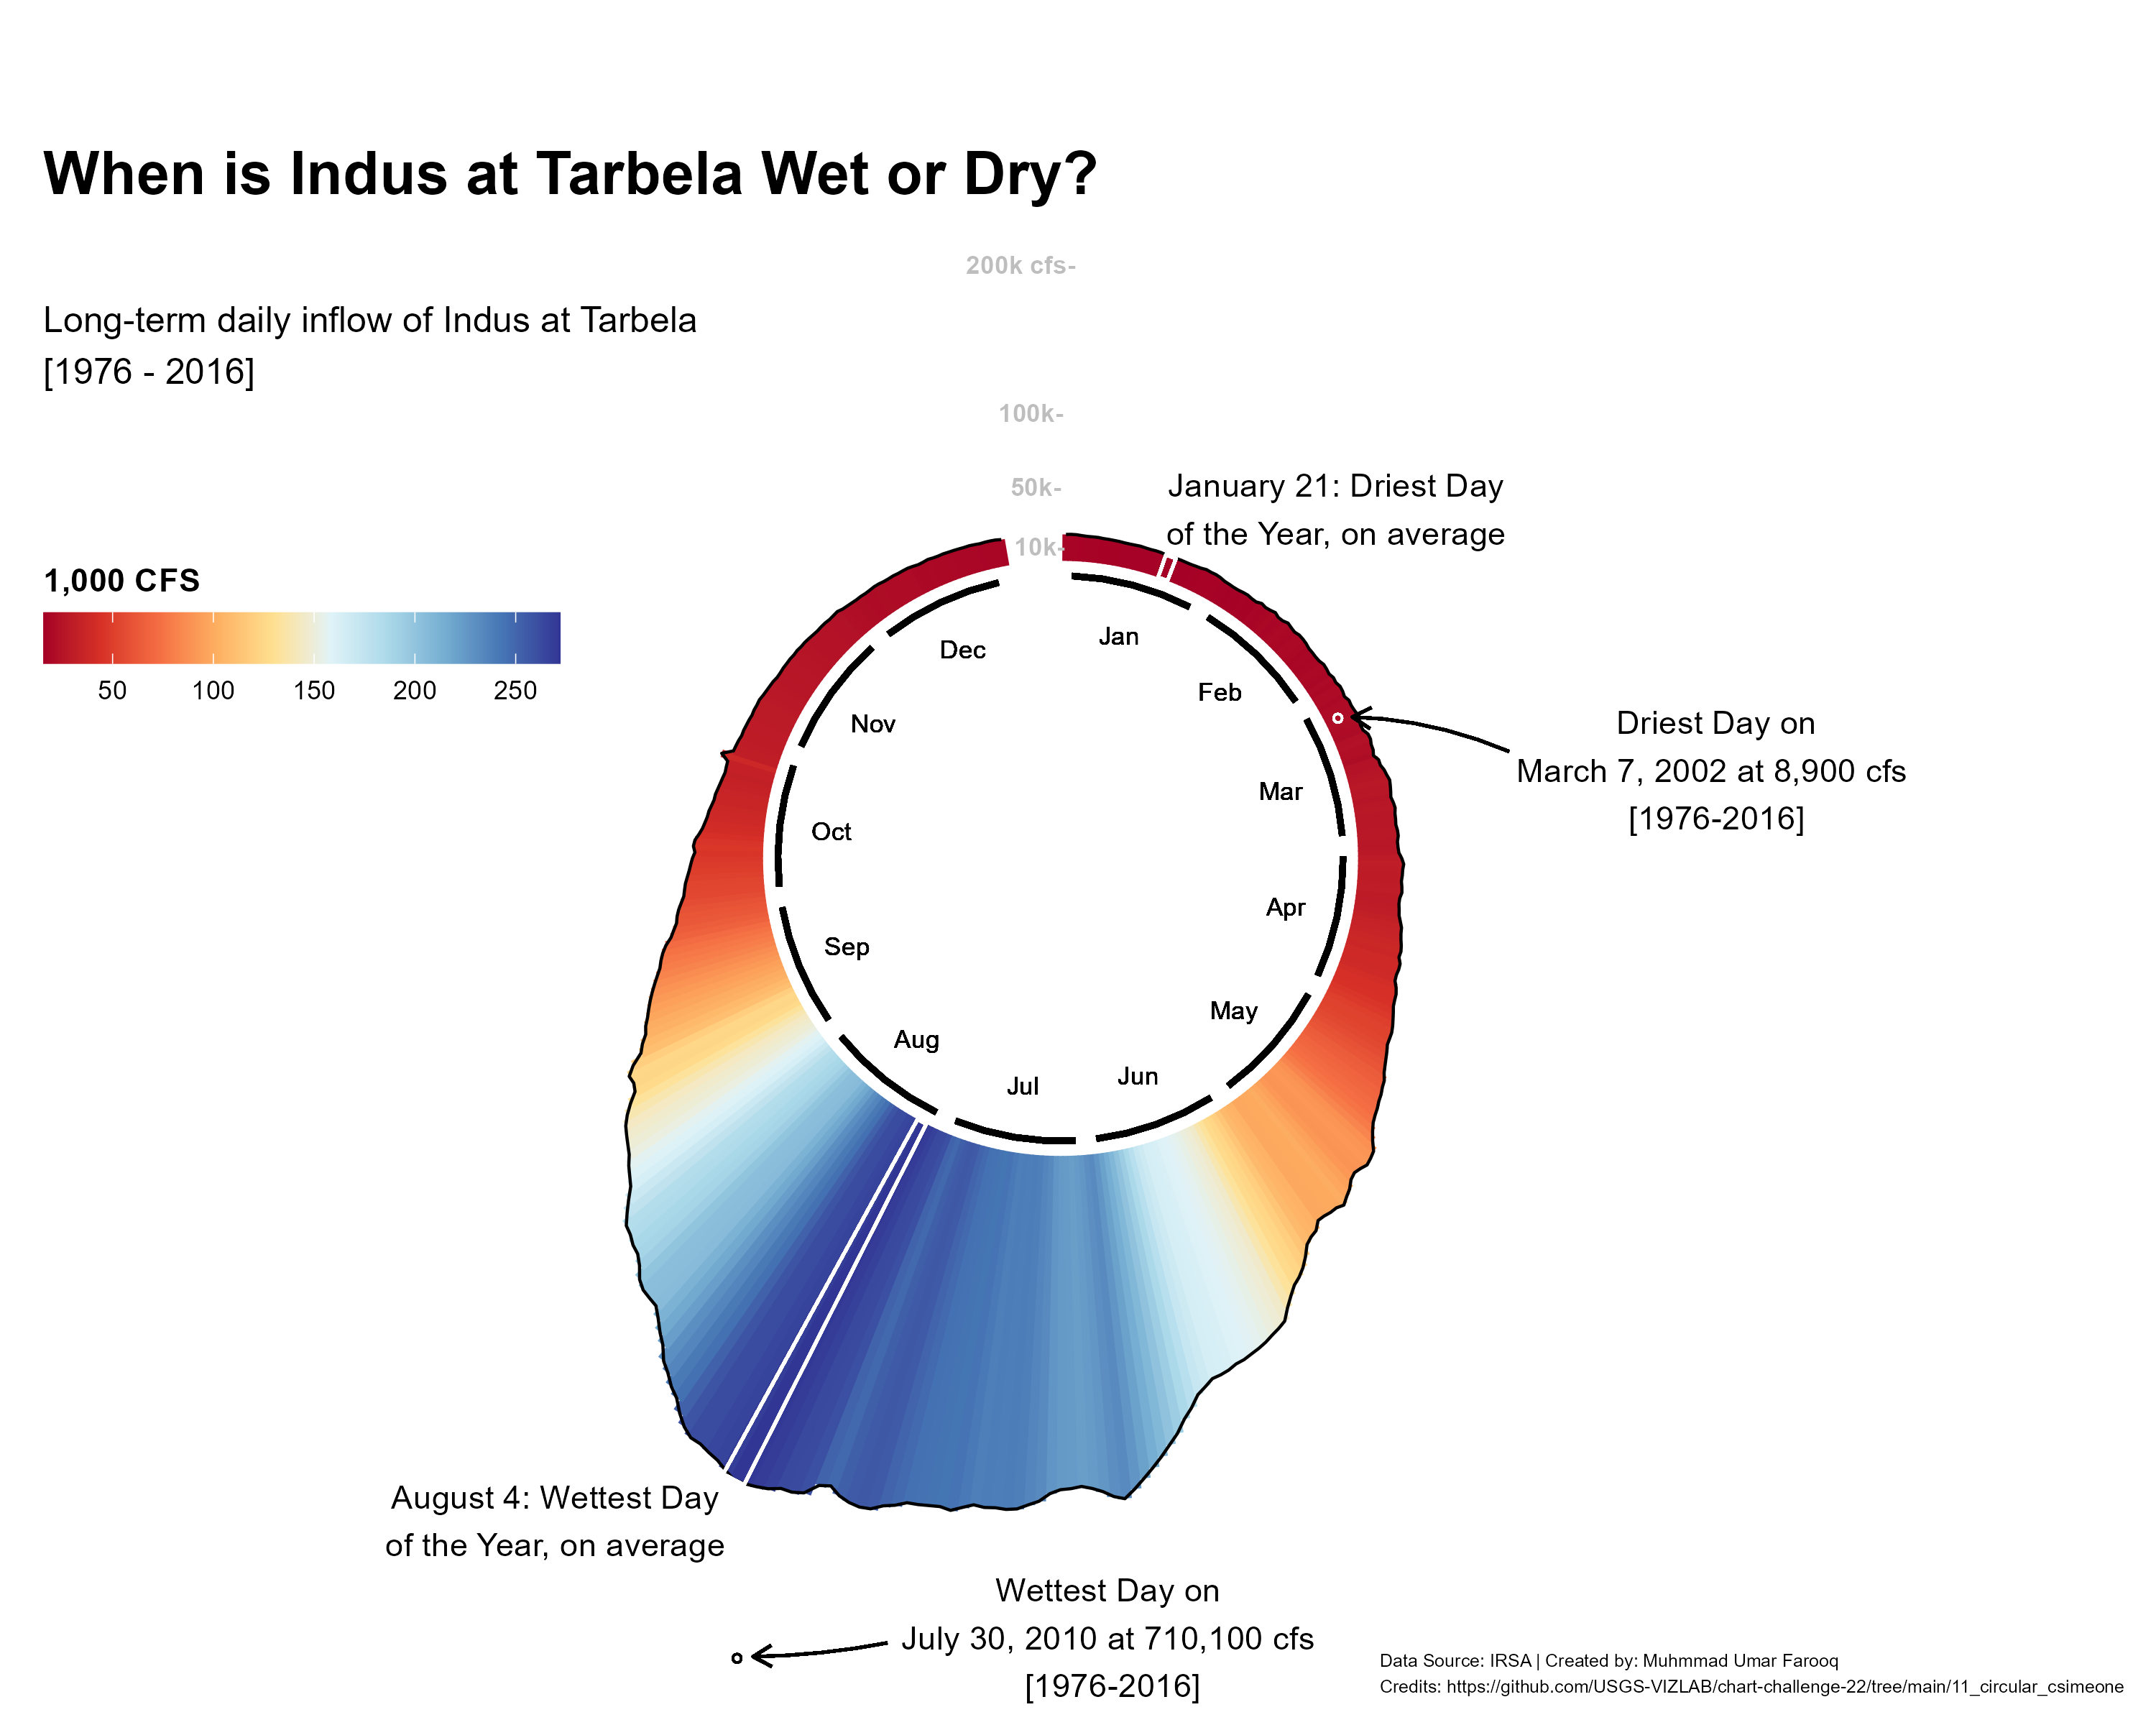
Indus at Tarbella
Pakistan irrigation system update
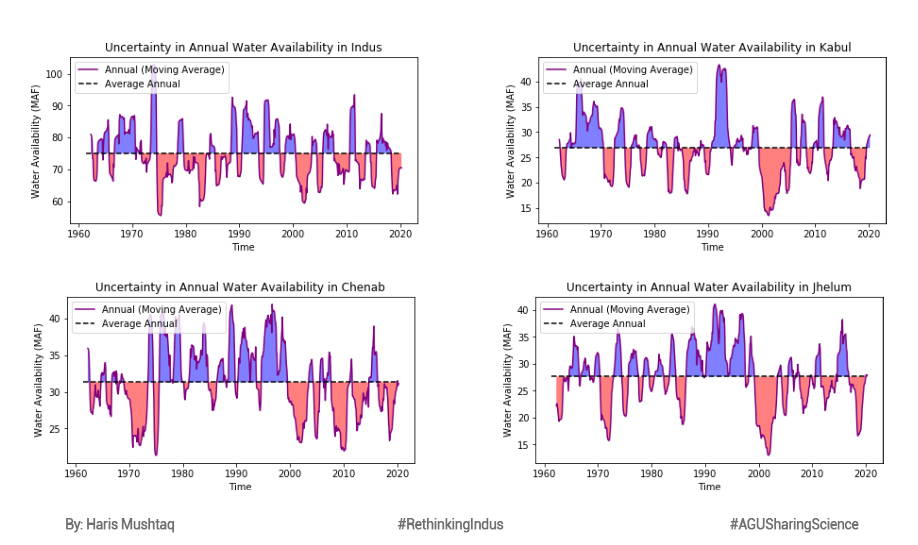
Water availability
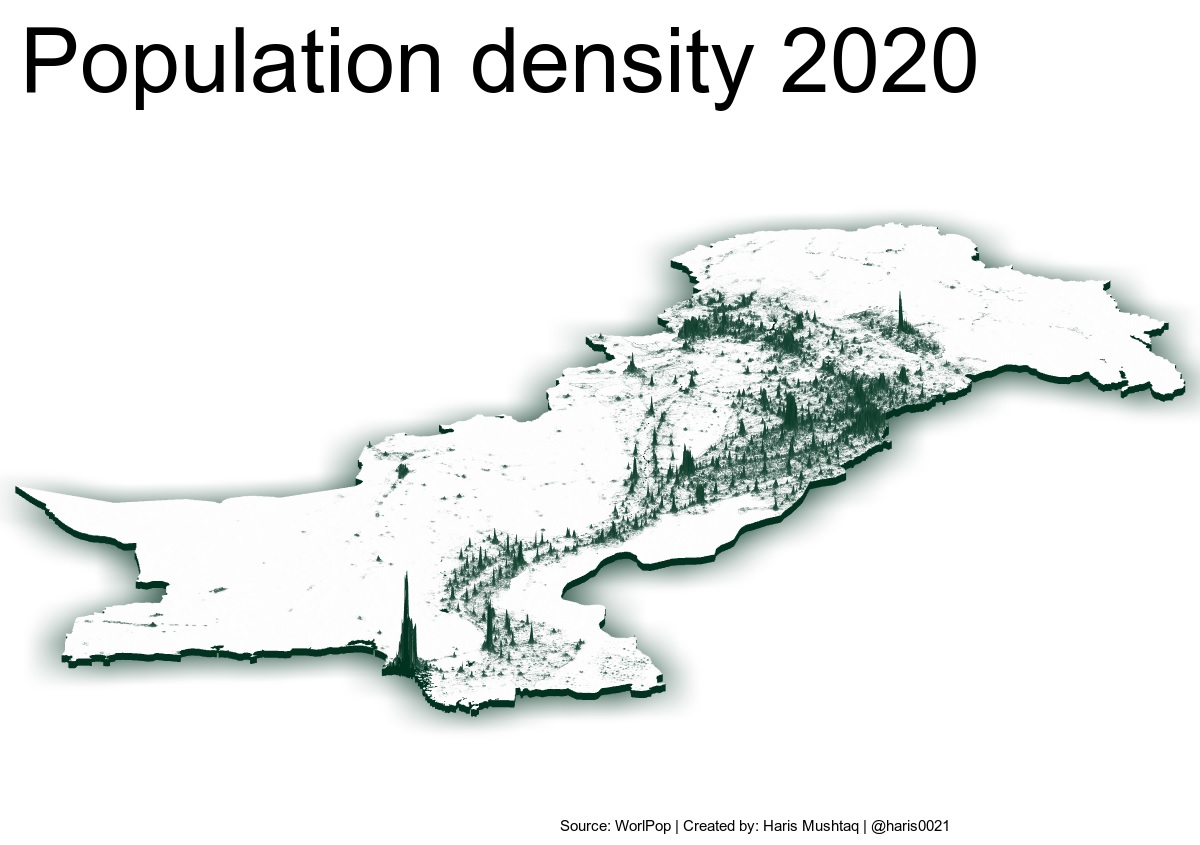
Population Density
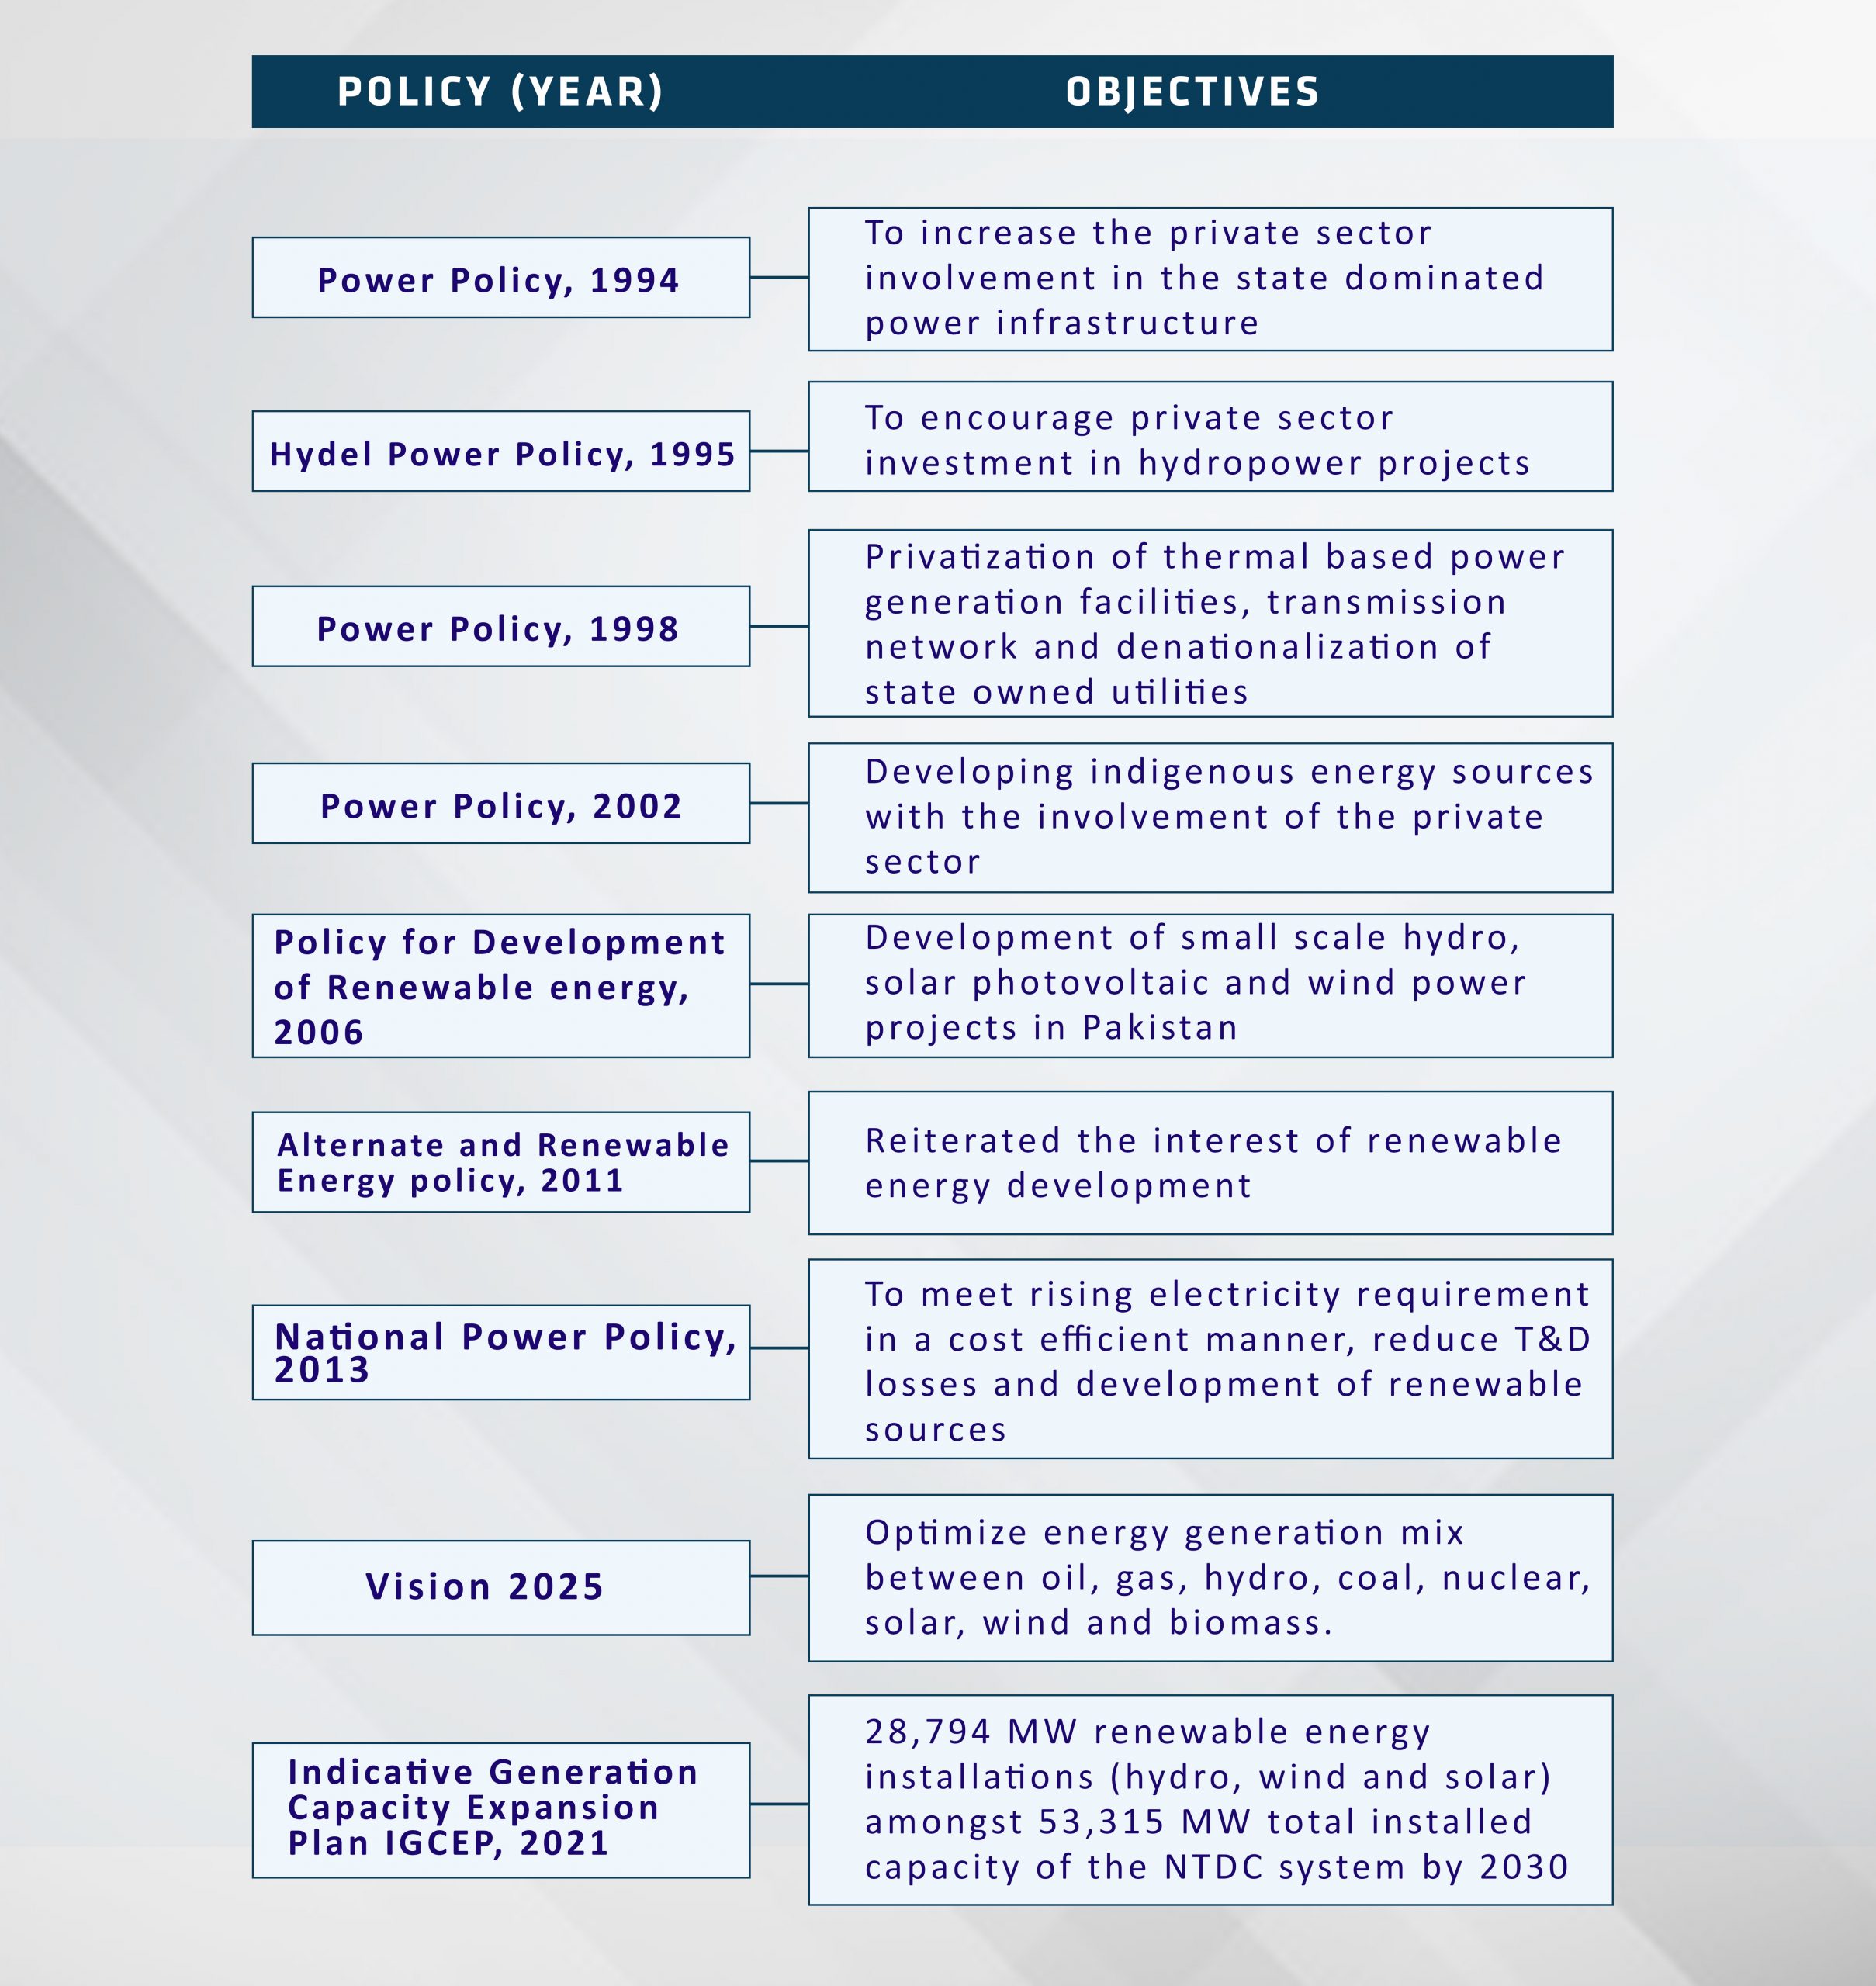
Flow Chart
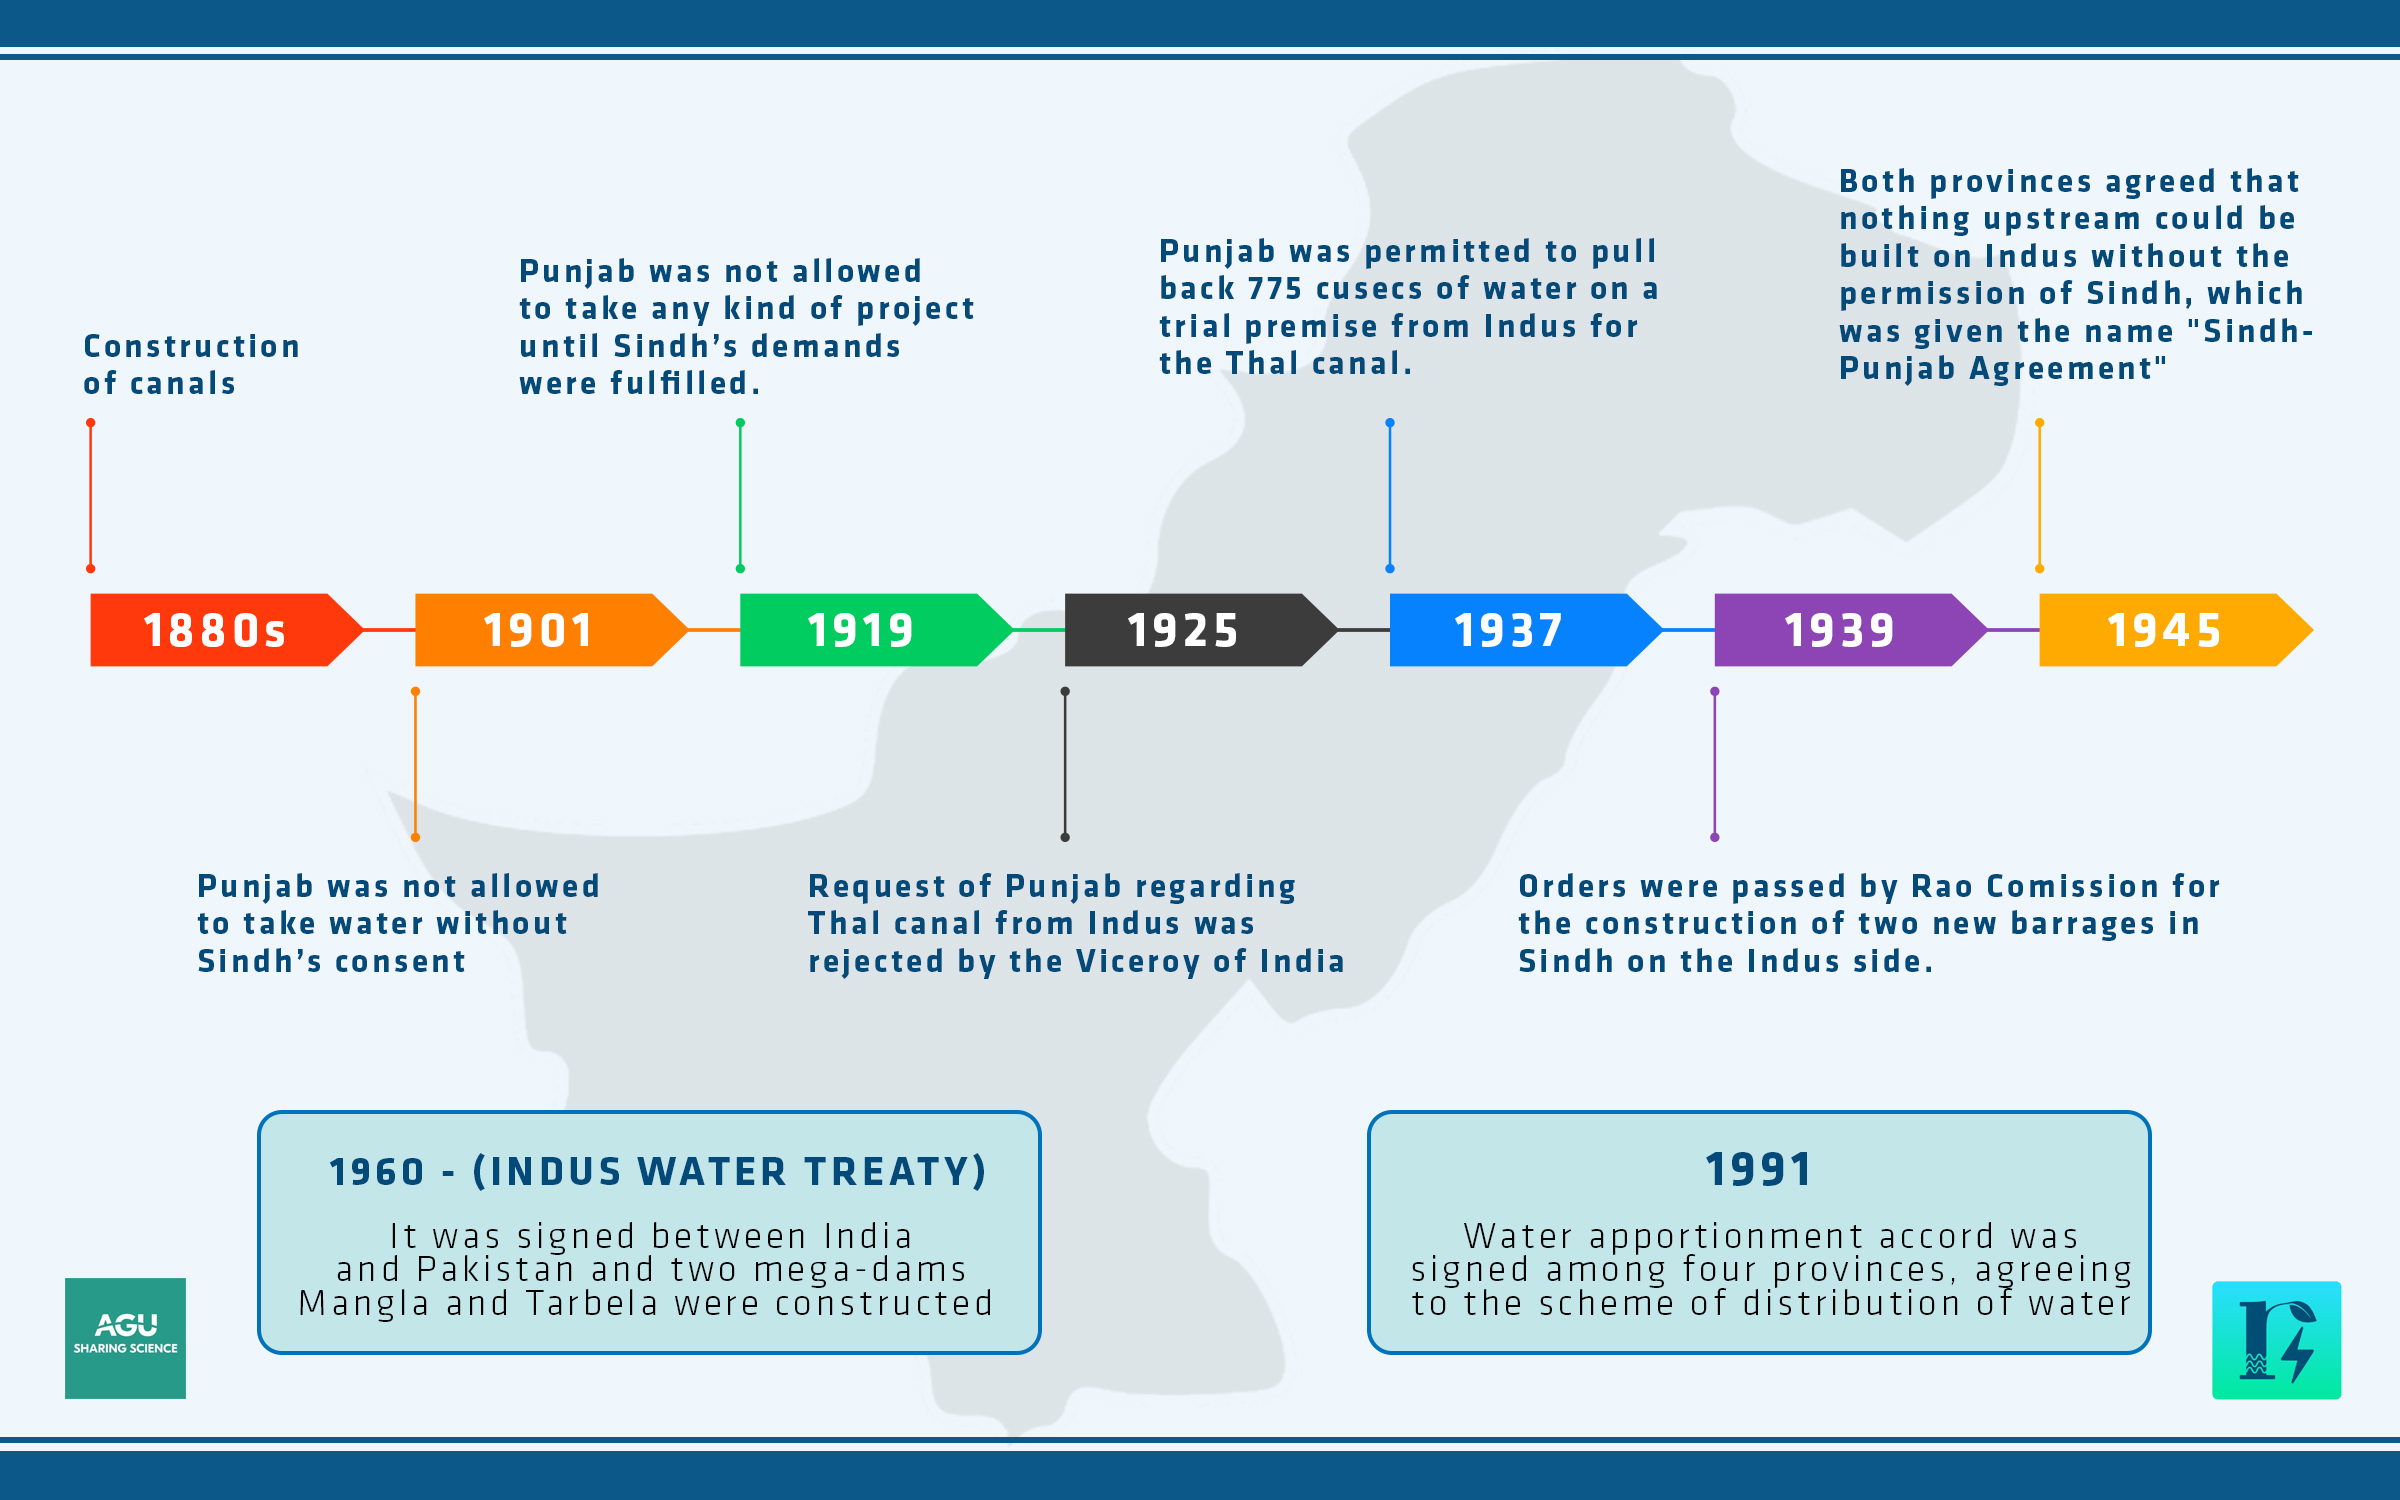
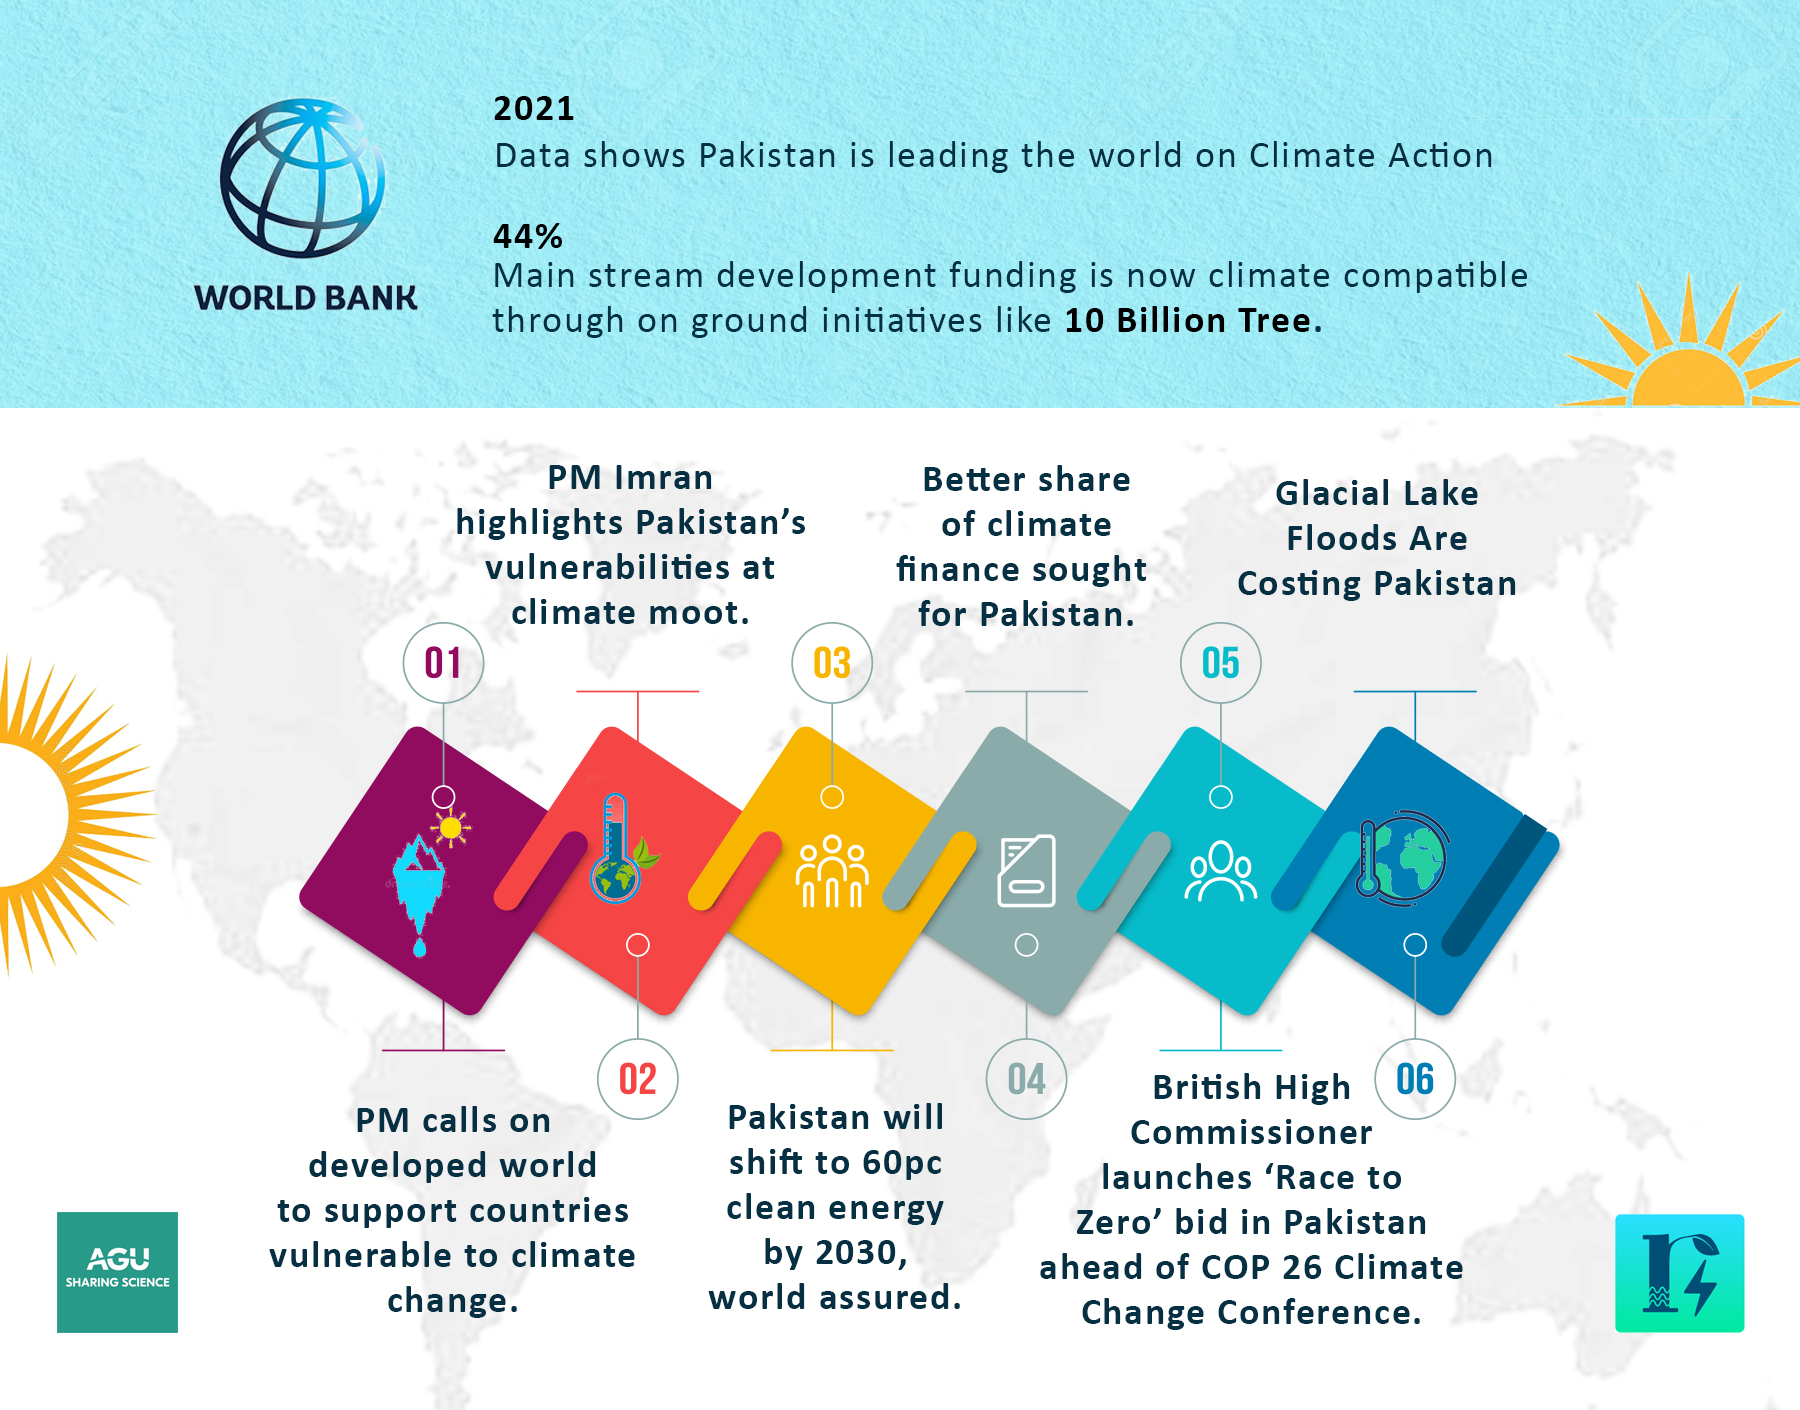
Time line Infographics
IBIS Final Version logo
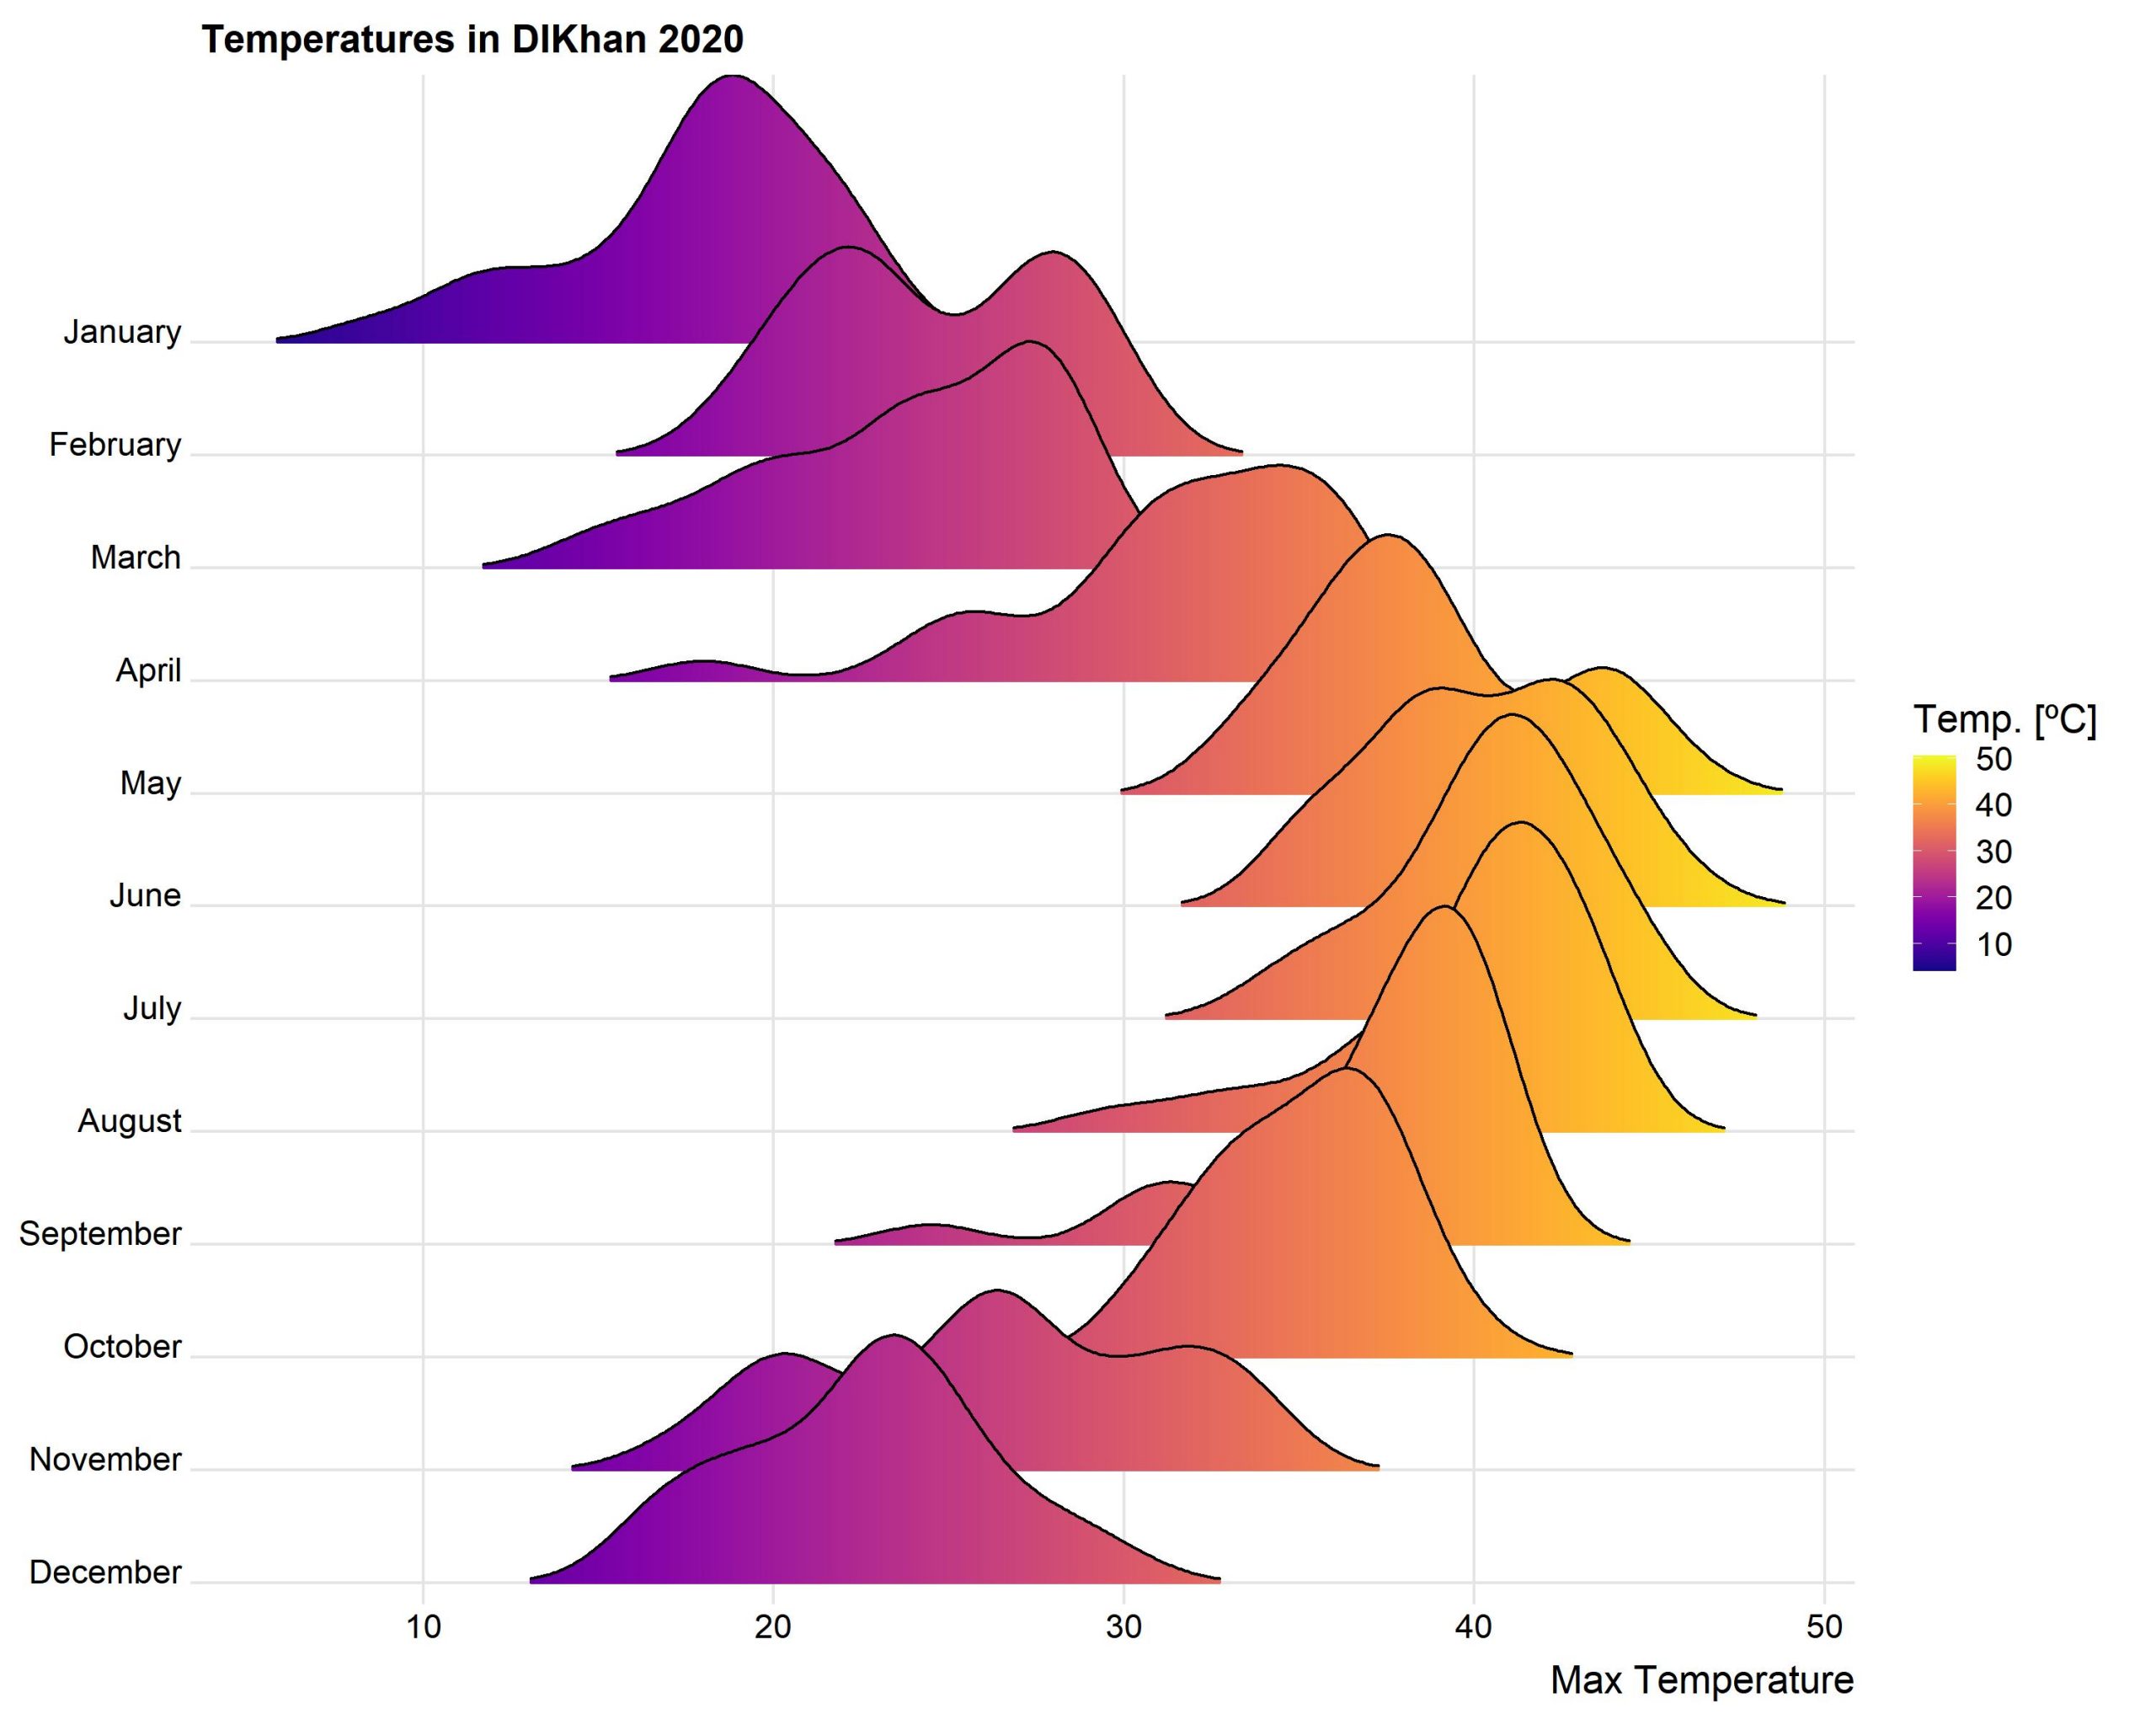
DI Khan
Installed Capacity by Time
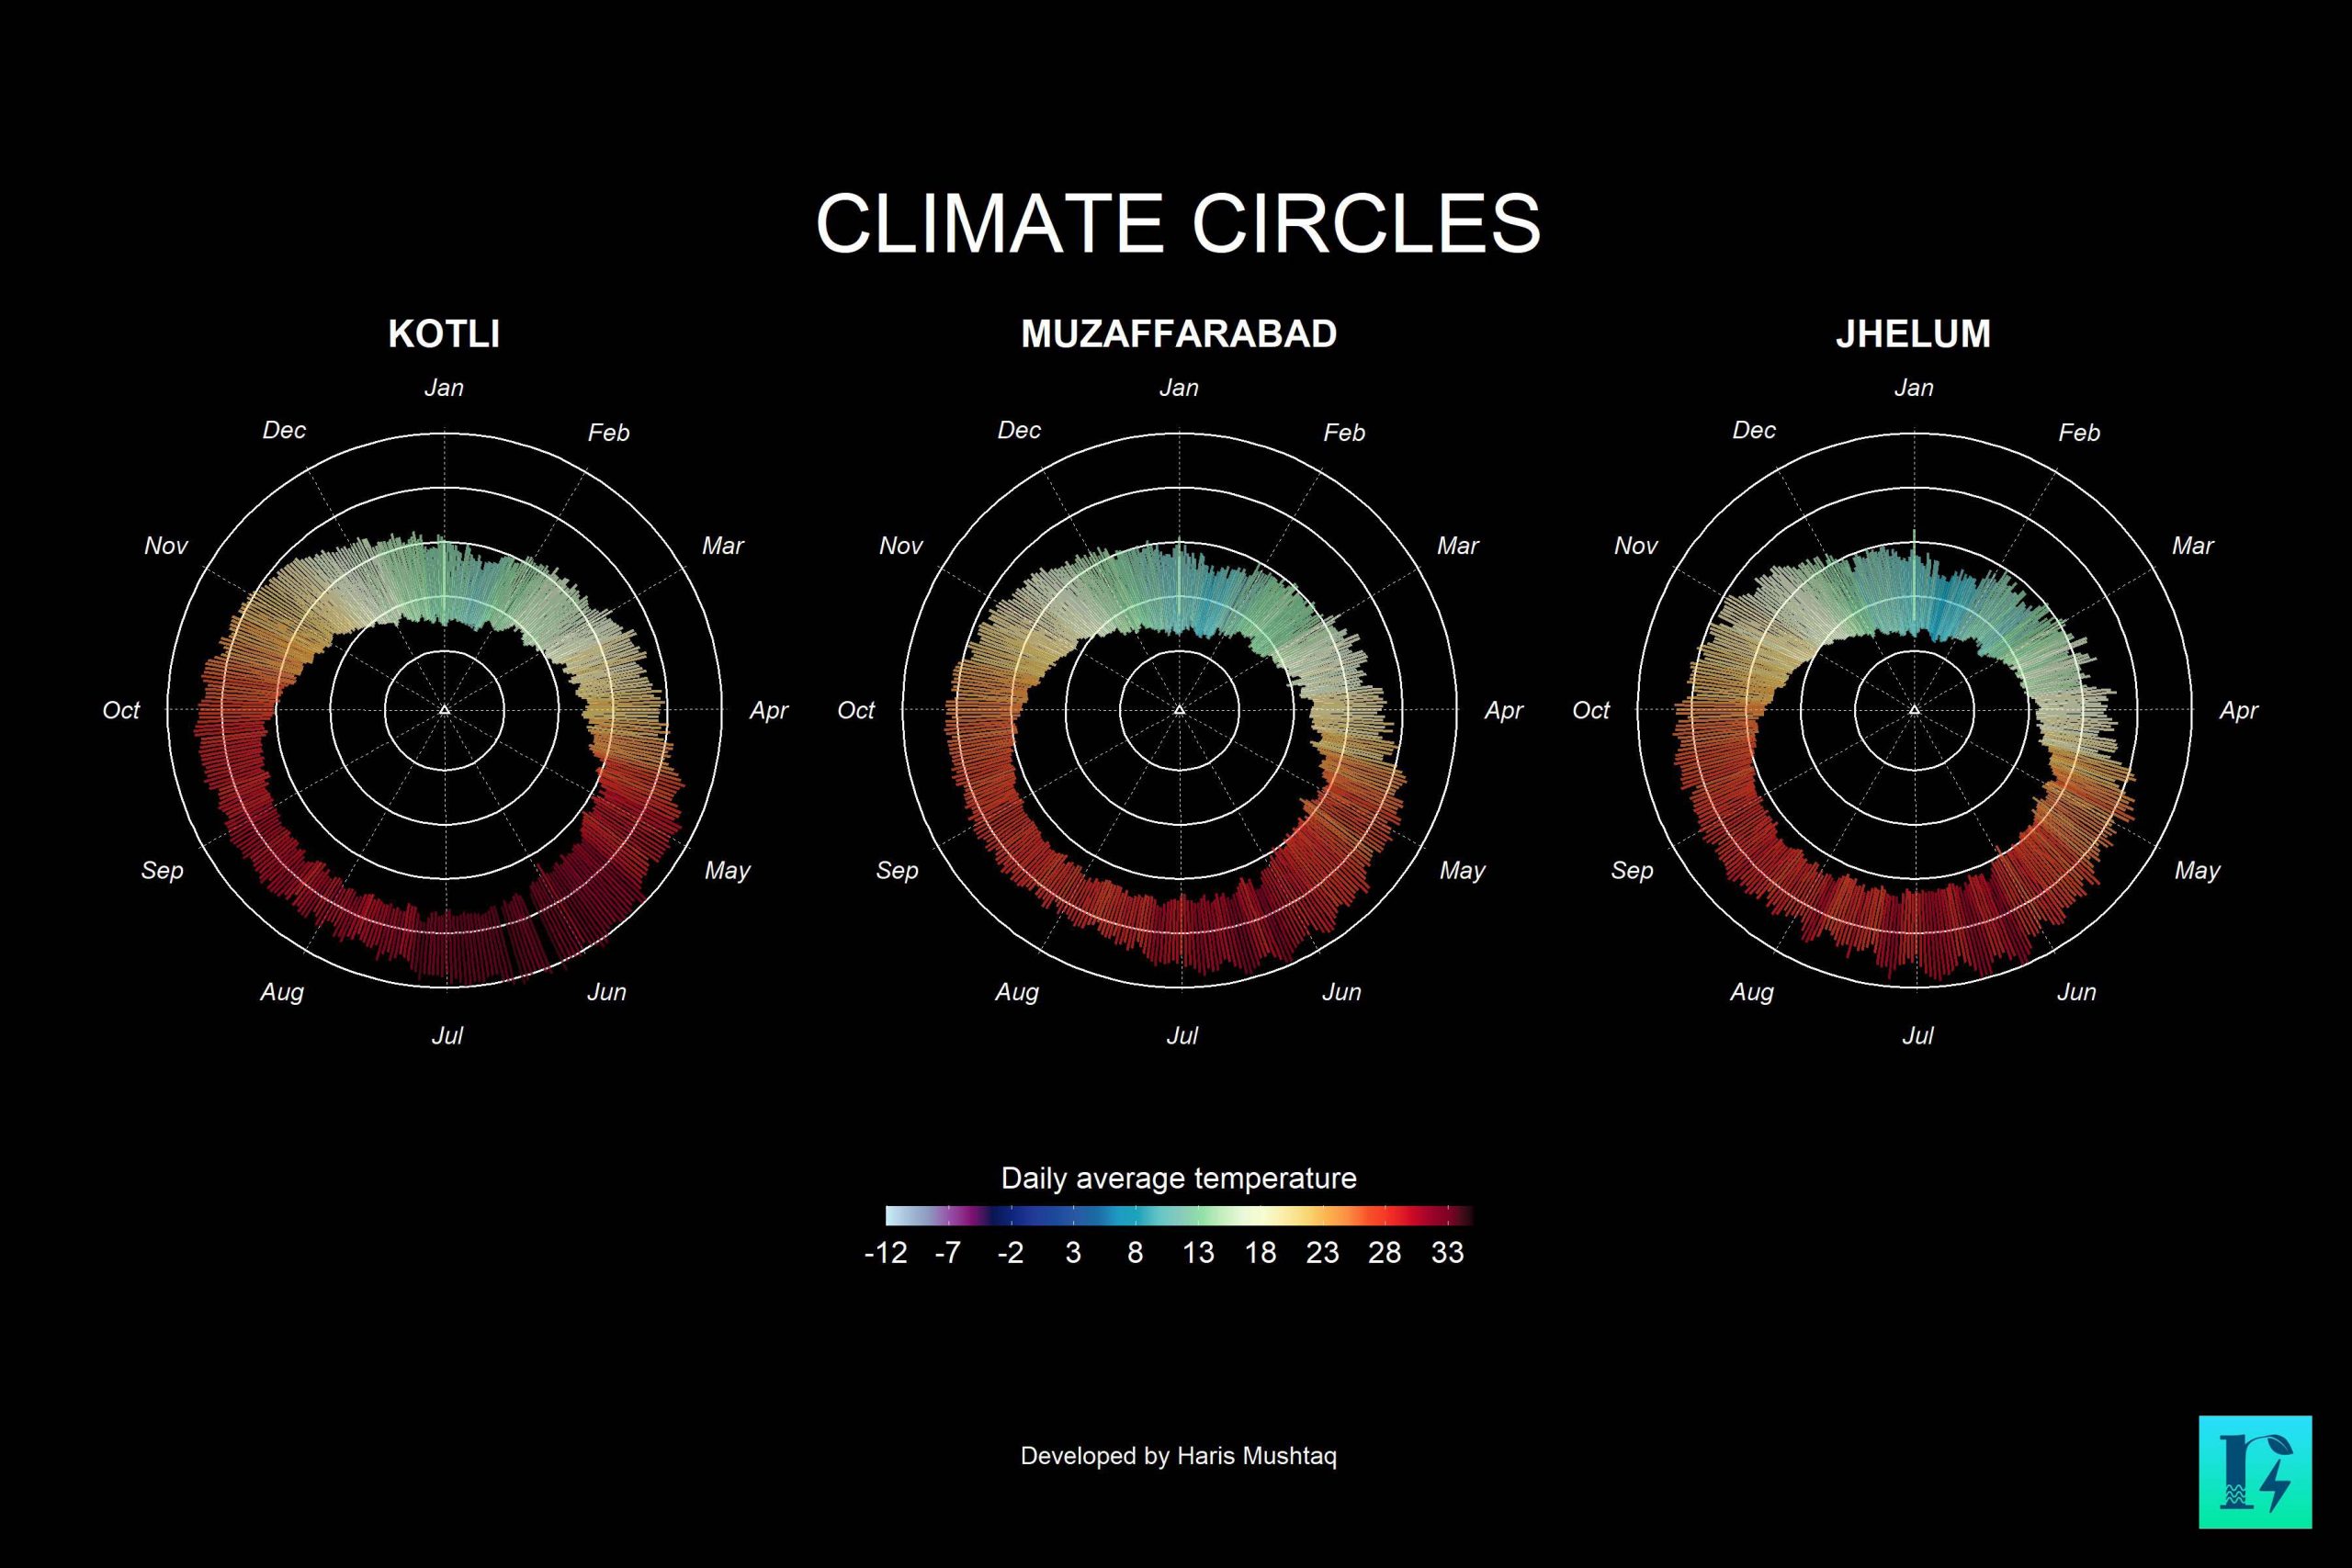
Climate Circles
Depiction of Water Appointment Accord 1991

Dashboard

EnergyBalance

Pakistan's Groundwater-Energy Nexus

Standard Streamflow
Publications


Articles


")
Our Team

Haris
Mushtaq

Dr. Taimoor
Akhtar

Muhammad Umar
Farooq
